Introduction:
We are generating a tremendous amount of data every second. Today’s common knowledge tells us that there are ample business opportunities for enterprises that want to put this data to work. Elasticsearch is one such tool that has the potential to run a business from the raw data rotting on the storage devices.
Elasticsearch is an opensource search engine and data analytics platform. Elastic Stack or ELK (Elasticsearch, Logstash, Kibana) is a group of opensource tools to collect, analyse and visualize information. ELK Stack is a highly scalable, distributed and multi-tenant capable real-time search engine that today is becoming highly popular among businesses. Just to give an example of the able use of this tool, the Guardian uses Elastic Stack to combine visitor logs with social network data to provide real-time feedback to their editors about the public responses to new articles.
Because of its advantages, Elastic Stack is becoming immensely popular not only in mega-corporations but also in startups. Owing to increasing demand for Elastic Stack in businesses, the developer community has put tremendous efforts into improving security features. Very recently Elastic developer community has made the most of the security features free of cost. In this blog, we will learn how to make your Elastic Cluster secure.
The security features
The security features of the community edition of Elastic Stack enable us to protect our data with a password, encrypt the communication between nodes, implement role-based access control, IP filtering and auditing. This tutorial describes how to secure cluster with password protection, secure Elastic APIs, define roles, create users and assign roles to users.
This guide assumes that you have a single node ELK instance in place. If you want to learn how to deploy Elastic stack you can follow this article first.
Securing Your Elastic Stack
By default, the security features are disabled. We will first configure Elasticsearch to enable security features. Open up elastic configuration file config/elasticsearch.yaml and paste the lines below at the end of the file.
config/elasticsearch.yaml |
...xpack.security.enabled: truexpack.security.transport.ssl.enabled: true |
Save the file and restart the elasticsearch service.
After restarting elasticsearch, we will set the passwords for the cluster. In a new terminal, we have to cd into our master node directory. Then we run the command bin/elasticsearch-setup-passwords auto. This will generate random passwords for the various internal stack users. You can alternatively skip the autoparameter to manually define your passwords using the interactive parameter.
Keep track of these passwords, we’ll need them again soon.
The next thing we need to do is configure Kibana. We’ll need to add the password for the Kibana user. We can grab that from the previous output of the setup-passwords command.
Let’s cd into the Kibana directory and open up the config/kibana.yml file with your text editor. Find the lines that look like this
config/kibana.yml |
...#elasticsearch.username: "user"#elasticsearch.password: "pass"... |
Uncomment the username and password fields by removing the # character at the beginning of the line. Change “user” to “kibana” and then change “pass” to whatever the setup-passwords command tells us the Kibana password is. Save the file then we can start Kibana by running bin/kibana.
The next thing we need to do is configure Logstash config files if you are planning to use Logstash in your stack otherwise you can skip following steps. We’ll need to add Elasticsearch credentials into Logstash configurations file output section. We can grab Elasticsearch credentials from the previous output of the setup-passwords command.
Let’s cd into the logstash directory and open up the output section of the Logstash config file with your text editor. Add highlighted lines into output section.
/etc/logstash/conf.d/sample.conf |
...output {elasticsearch {index => "indexname"user => "elastic"password => "pass"document_id => "%{id}"hosts => ["localhost:9200"]}}... |
change “pass” to whatever the setup-passwords command tells us the elastic password is.
Now restart elasticsearch and kibana services.
Congratulations! You have successfully secured your Elastic Cluster.
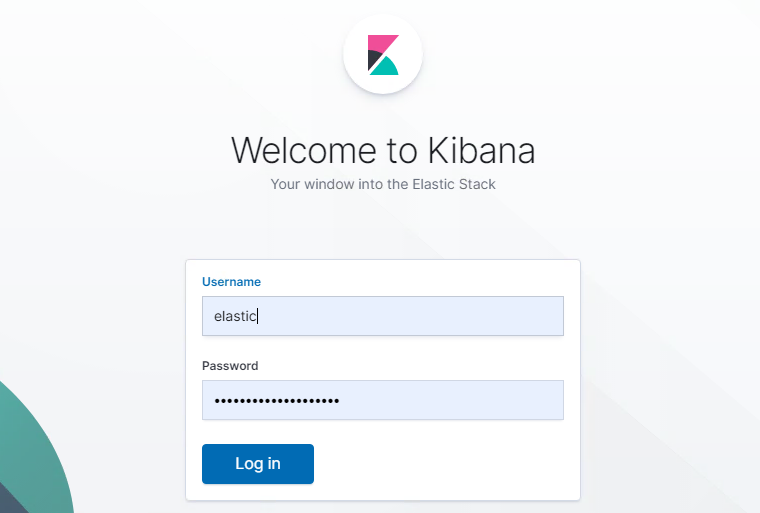
Now to your kibana dashboard, a login screen will appear. In order to access the Kibana dashboard as a superuser, you will have to provide the “elastic” as the username and the password to whatever the setup-passwords command gave us the “elastic” password is.
Once you log in as superuser, you can have the ability to create security roles and create users and assign roles


